Gantt charts are useful project management tools that provide a visual representation of a project’s timeline and tasks. Named after Henry Gantt, who popularized this type of chart in the early 1900s, Gantt charts have become an essential component of modern project management.
What is a Gantt chart?
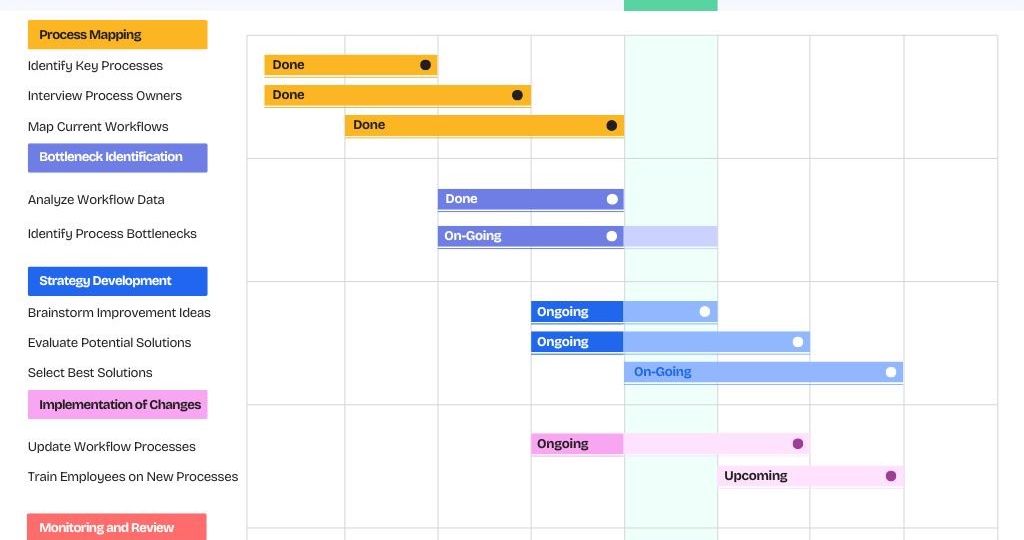
A Gantt chart is a horizontal bar chart that illustrates a project schedule over time. It displays project activities along the vertical axis and a timeline across the horizontal axis. Each task is represented by a horizontal bar, with the length of the bar indicating the task’s duration.
Key components of a Gantt chart include:
- Tasks: Listed vertically on the left side of the chart
- Timeline: Displayed horizontally across the top
- Taskbars: Horizontal bars representing task duration
- Milestones: Important project events or deadlines
- Dependencies: Relationships between tasks
- Resource assignments: Team members responsible for each task
Why Use Gantt charts?
Gantt charts offer several advantages in project management:
- Visual clarity: They provide a clear, easy-to-understand overview of the project timeline and progress.
- Task dependencies: Gantt charts help identify and manage task relationships, ensuring proper sequencing of activities.
- Resource allocation: They allow project managers to assign and track resources effectively.
- Progress tracking: Team members can easily update task status, providing real-time project progress information.
- Communication: Gantt charts facilitate better communication among team members and stakeholders by presenting complex project information in a digestible format.
When to Use Gantt charts
Gantt charts are particularly useful for:
- Projects with multiple interconnected tasks
- Time-sensitive projects with specific deadlines
- Projects requiring coordination among various team members or departments
- Complex projects with numerous dependencies
Creating and Using Gantt charts
Modern project management software has made creating and maintaining Gantt charts much easier. A basic process looks like this:
- List all project tasks
- Determine task durations and dependencies
- Identify key milestones
- Assign resources to tasks
- Input this information into your chosen Gantt chart software
Once created, Gantt charts can be used to:
- Monitor project progress
- Adjust timelines and resources as needed
- Communicate project status to stakeholders
- Identify potential bottlenecks or conflicts
Adapting Gantt charts for different audiences
While Gantt charts are comprehensive project management tools, they can be tailored for different audiences:
- Project managers: Use the full, detailed chart for day-to-day management.
- Team members: Focus on relevant tasks and immediate deadlines1.
- Stakeholders: Present a simplified version highlighting major phases and milestones1.
Integrating Gantt Charts with other project management tools
Gantt charts can be used in conjunction with other project management methodologies and tools. For example, teams might use Notion or Trello for daily task management while relying on Gantt charts for overall project planning and tracking. Or you can use tools such as Asana to create Gantt charts.
Gantt charts have really stood the test of time as effective project management tools thanks to their ability to provide a visual, intuitive way to plan, schedule and track projects. They are invaluable for managing complex, time-sensitive initiatives. Moreover, modern software means that Gantt charts are more accessible and user-friendly than ever and continue to be a go-to solution for project managers across a range of industries.


